Next Step: Make Cards on the Automatic Key Concepts, and Vignettes
Remember, the more you automatically know what each sentence means on your test, the better you will do. There are 4 stages in making interpretation more automatic:
- Stage 1: Unable to Make Pathophysiologic Chronologies in Either Timed or Untimed setting
- Stage 2: Basic Pathophysiologic Chronologies, but with Significant Gaps
- Stage 3: Detailed Pathophysiologic Chronology Without Time, but Unable to Consistently Generate PC During Timed Setting
- Stage 4: Consistent Pathophysiologic Chronologies in Timed Setting
My goal with these vignettes is to help you reach Stage 4. How do you do so?
- With the Automatic Key Concept cards, you can master the underlying information to move past Stages 1 + 2.
- Then, with the Vignette/Pathophysiologic Chronology cards, you can teach yourself to make these connections on your exam.
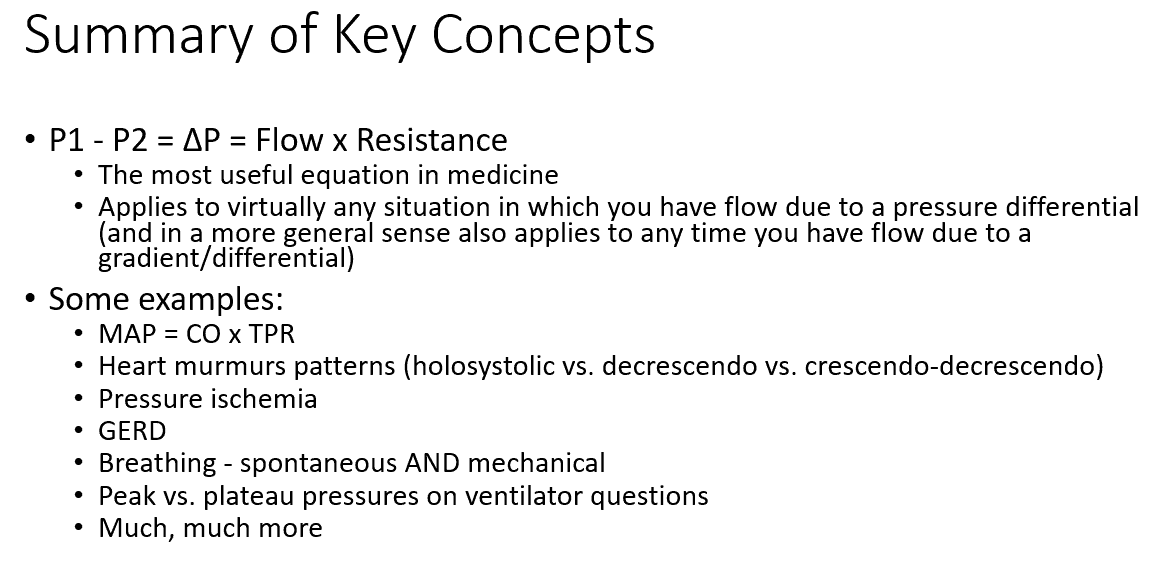
summary of key concepts:
automatic key concepts:
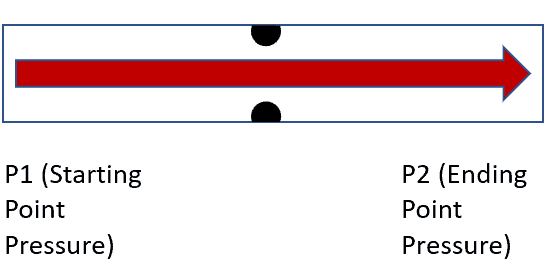
Using the equation ΔP = Flow x Resistance, explain what the effects of increasing P1 would be. How about increasing P2?
P1 ↑ → ΔP ↑ → flow ↑
P2 ↑ → ΔP ↓ → flow ↓
Using the equation ΔP = Flow x Resistance, explain what the effects of increasing resistance be on P1, P2, and flow? What analogy can you use to explain this?
Resistance ↑ → P1 ↑, P2 ↓, and flow ↓
This is analogous to if you had a garden hose, and kinked the middle
Upstream of the kink, pressure (P1) ↑
Downstream of the kink, pressure (P2) ↓
Flow out of the garden hose ↓
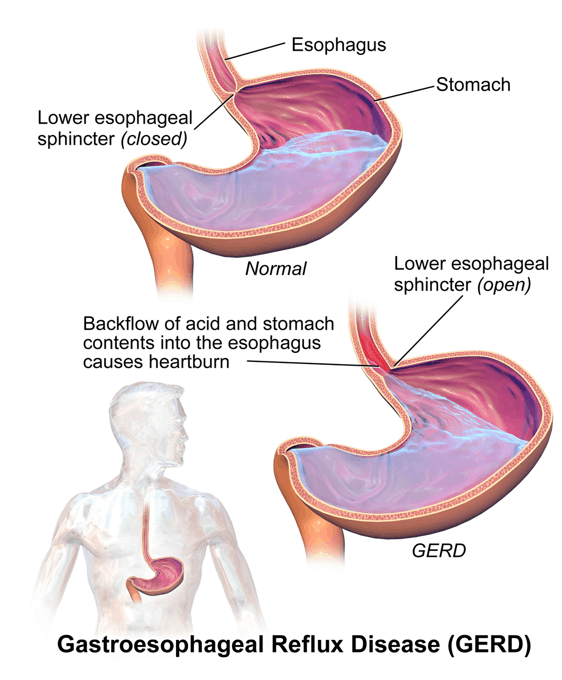
GERD – what are the risk factors? What concept can you use to understand this generally?
GERD is the reflux of gastric contents from the stomach through the lower esophageal sphincter. You can think of it as “flow” in the equation: P1 – P2 = ΔP = Flow x Resistance
Hiatal hernia (resistance ↓), obesity (P1 ↑), hypersecretory states (P1 ↑ / resistance ↓), delayed emptying (P1 ↑ / resistance ↓), large meals (P1 ↑ / resistance ↓)
*Anything that:
Increases intragastric pressure:
-
- Stomach volume ↑ (e.g., delayed emptying, large meals, hypersecretory states) / stomach pressure ↑ (e.g., obesity) → P1 ↑ → (P1 – P2) ↑ → flow ↑
Decreases strength of lower esophageal sphincter → resistance ↓ → flow ↑
GERD – what are the only evidence-based lifestyle modifications? Why would these make sense logically?
Concept: P1 – P2 = ΔP = Flow x Resistance
Weight loss: P1 ↓ → (P1 – P2) ↓ → flow (reflux) ↓
Head of bed elevation: essentially making the reflux flow uphill
Mitral valve stenosis – what effect would this have on the LA pressure, LV pressure, and flow across the mitral valve? How can you understand this?
P1 – P2 = ΔP = Flow x Resistance
Mitral valve stenosis = resistance ↑ between the LA (P1) and LV (P2) → LA pressure (P1) ↑, LV pressure (P2) ↓, flow ↓
Pulmonary wedge pressure – where exactly is the catheter? Why is it “wedge”?
Pulmonary artery catheter has a balloon at the tip that is inflated within the pulmonary artery, after passing through the RA and RV. While in the PA, it is advanced until it is “wedged” (gets stuck and can’t be advanced more with gentle pressure)
Pulmonary wedge pressure – use how it is done to explain what it can measure
Pulmonary artery catheter with balloon tip wedged in the pulmonary artery → pressure is measured DISTAL to the obstruction. That distal pressure is roughly equivalent to the chambers distal to this:
LA pressure, LV end-diastolic pressure (LVEDP)
Pulmonary wedge pressure – what pressures is it used to estimate? Under what circumstances would this be less accurate?
Can be used to estimate the LA and LV end-diastolic pressures. This is a reasonable estimate as long as there isn’t significant resistance between the chambers (e.g., mitral stenosis) that would cause differences in pressure between the pulmonary vein, LA, and LV.
For the equation, MAP – CVP = CO x TPR, where is the blood coming from (P1)? Where is it going to (P2)?
In this case, P1 = MAP (the systemic arterial pressure), and P2 = CVP (pressure in the SVC/IVC)
For the equation, MAP – CVP = CO x TPR, TPR (also known as SVR) is the resistance between what two points?
Recall that in the equation P1 – P2 = ΔP = Flow x Resistance, P1 = pressure where flow is coming FROM, P2 = pressure where flow is going TO, and resistance = total resistance between those two points
In this case, then, TPR = basically all of the resistance to blood flow between the arterial system and the SVC/IVC.
For the equation (MAP – CVP = CO x TPR), how is it normally written? Why is this, practically?
Usually, written MAP = CO x TPR; CVP is typically 2-6 mmHg, with MAP between 70-100. As such, CVP << MAP.
In addition, to measure MAP, all you need is a blood pressure cuff. To measure CVP, you need to insert a central line
Finally, the utility in the equation MAP = CO x TPR is not in its precision, but rather in the broad applicability to understand much of cardiac physiology (more on this in the cardio lessons)
Pressure ischemia – what equation can you use to explain this phenomenon? Why would this make sense?
P1 – P2 = ΔP = Flow x Resistance
By putting external pressure on capillary beds → resistance ↑ → P1 ↑, P2 ↓, and flow ↓ → tissue hypoperfusion → ischemia → if prolonged, then necrosis
When you sit for a long time and you skin feels numb/tingling, what equation and concept can you use to explain this?
Equation: P1 – P2 = ΔP = Flow x Resistance
Concept: transient ischemia = dysfunction
Sitting for a long time → resistance ↑ → flow ↓ → transient nerve ischemia → transient dysfunction (e.g., numbness, paresthesias)
Pressure ulcers – what equation and concept can you use to explain this?
Equation: P1 – P2 = ΔP = Flow x Resistance
Concept: prolonged ischemia = necrosis
Long pressure on tissue → resistance ↑ → flow ↓ → prolonged tissue (muscle, skin) ischemia → necrosis → skin breakdown → ulceration
Heart murmurs – physiologically, what are the ways that a murmur volume can increase? Use an equation to explain
In a general sense, a heart murmur can occur when there is:
-
- 1) A more diseased valve/portion of blood vessel, and/or
- 2) Greater velocity of blood across that valve / vessel
For 2), you can use the equation ΔP = Flow x Resistance, with flow as a rough approximation of blood velocity for a fixed valve lesion
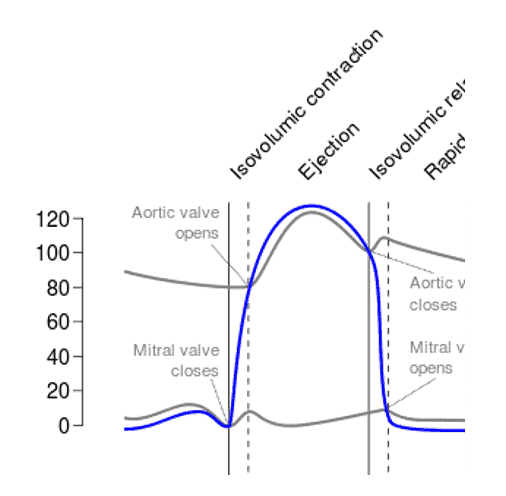
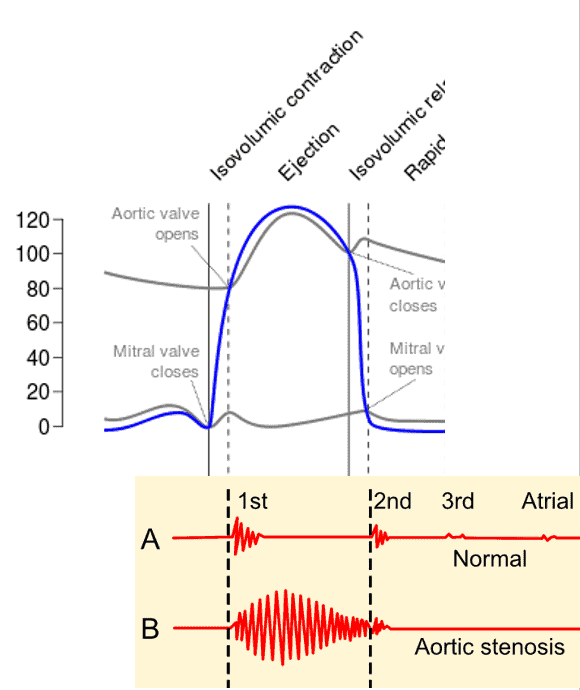
Using the equation P1 – P2 = Flow x Resistance, explain at what point the aortic valve opens?
P1 = LV pressure, P2 = aortic pressure
When (P1 – P2) is a positive number, flow is positive. Thus, it makes sense that the aortic valve would open when LV pressure > aortic pressure
Using the equation P1 – P2 = Flow x Resistance, explain at what point the mitral valve opens?
P1 = LA pressure, P2 = LV pressure
When (P1 – P2) is a positive number, flow is positive. Thus, it makes sense that the mitral valve would open when LA pressure > LV pressure
Aortic flow – RELATIVELY speaking, just after the aortic valve opens, what will be the flow across the aortic valve? Use an equation to make sense of this.
Recall: P1 – P2 = Flow x Resistance
For flow across the aortic valve:
P1 = LV pressure (blood coming FROM)
P2 = aortic pressure (blood going TO)
Resistance = aortic valve resistance
At the moment the aortic valve opens, P1 will be BARELY higher than P2. As such, flow will be positive (but barely)
Aortic flow – RELATIVELY speaking, at mid-systole, what will the flow be relative to the beginning of systole? Why?
Recall: P1 – P2 = Flow x Resistance
For flow across the aortic valve:
P1 = LV pressure (blood coming FROM)
P2 = aortic pressure (blood going TO)
Resistance = aortic valve resistance
At the moment the aortic valve opens, P1 will be BARELY higher than P2. As such, flow will be positive (but barely)
Near mid-systole, however, (P1 – P2) ↑ → flow ↑
Aortic stenosis – using an equation, explain what the character of the murmur will be (e.g., holosystolic, decrescendo, crescendo-decrescendo). Why does this make sense?
Crescendo-decrescendo
Recall: P1 – P2 = Flow x Resistance
For flow across the aortic valve:
P1 = LV pressure (blood coming FROM)
P2 = aortic pressure (blood going TO)
Resistance = aortic valve resistance
As the LV contracts → P1 ↑. Initially, (P1 – P2) ↑ → flow ↑ → murmur will crescendo (get louder) earlier.
However, as near the end of systole, (P1 – P2) ↓ → flow ↓ → murmur will decrescendo (get softer)
Aortic regurgitation – using an equation, explain when will the regurgitant flow be the greatest across the aortic valve?
Regurgitant flow will be highest after the mitral valve opens
Recall: P1 – P2 = Flow x Resistance
In this case, because it is blood REGURGITATION (the reverse of normal):
P1 = aortic pressure (blood coming FROM)
P2 = LV pressure (blood going TO)
Just after the mitral valve opens:
-
- P1 is relatively high (before much blood has been distributed to the rest of the body)
- P2 is at the lowest (it has just ejected its stroke volume, and hasn’t been filled up by the LA / aorta yet)
In other words, the moments after the mitral valve opens (P1 – P2) highest → flow highest
Aortic regurgitation – using an equation, explain what the character of the murmur will be (e.g., holosystolic, decrescendo, crescendo-decrescendo). Why does this make sense?
Decrescendo
Recall: P1 – P2 = Flow x Resistance
In this case, because it is blood REGURGITATION (the reverse of normal):
P1 = aortic pressure (blood coming FROM)
P2 = LV pressure (blood going TO)
Just after the mitral valve opens:
-
- P1 is relatively high (before much blood has been distributed to the rest of the body)
- P2 is at the lowest (it has just ejected its stroke volume, and hasn’t been filled up by the LA / aorta yet)
In other words, the moments after the mitral valve opens (P1 – P2) highest → flow highest → murmur loudest early → as (P1-P2) ↓ → regurgitant flow ↓ → murmur softer later in the cycle
references:
GERD.png. (2020, October 7). Wikimedia Commons, the free media repository. Retrieved 02:02, April 27, 2021 from https://commons.wikimedia.org/w/index.php?title=File:GERD.png&oldid=483203113.
Pulmonary artery catheter english.JPG. (2020, October 18). Wikimedia Commons, the free media repository. Retrieved 02:20, April 2, 2021 from https://commons.wikimedia.org/w/index.php?title=File:Pulmonary_artery_catheter_english.JPG&oldid=493462725.
Circulation of blood through the heart.png. (2020, December 23). Wikimedia Commons, the free media repository. Retrieved 04:13, April 2, 2021 from https://commons.wikimedia.org/w/index.php?title=File:Circulation_of_blood_through_the_heart.png&oldid=520574500.
Radial artery catheterization.jpg. (2020, October 7). Wikimedia Commons, the free media repository. Retrieved 05:01, April 2, 2021 from https://commons.wikimedia.org/w/index.php?title=File:Radial_artery_catheterization.jpg&oldid=483583496.
Phonocardiograms from normal and abnormal heart sounds.png. (2020, October 3). Wikimedia Commons, the free media repository. Retrieved 06:06, April 2, 2021 from https://commons.wikimedia.org/w/index.php?title=File:Phonocardiograms_from_normal_and_abnormal_heart_sounds.png&oldid=478934031.
Wiggers Diagram.svg. (2020, September 12). Wikimedia Commons, the free media repository. Retrieved 06:07, April 2, 2021 from https://commons.wikimedia.org/w/index.php?title=File:Wiggers_Diagram.svg&oldid=456197904.

