Next Step: Make Cards on the Automatic Key Concepts, and Vignettes
Remember, the more you automatically know what each sentence means on your test, the better you will do. There are 4 stages in making interpretation more automatic:
- Stage 1: Unable to Make Pathophysiologic Chronologies in Either Timed or Untimed setting
- Stage 2: Basic Pathophysiologic Chronologies, but with Significant Gaps
- Stage 3: Detailed Pathophysiologic Chronology Without Time, but Unable to Consistently Generate PC During Timed Setting
- Stage 4: Consistent Pathophysiologic Chronologies in Timed Setting
My goal with these vignettes is to help you reach Stage 4. How do you do so?
- With the Automatic Key Concept cards, you can master the underlying information to move past Stages 1 + 2.
- Then, with the Vignette/Pathophysiologic Chronology cards, you can teach yourself to make these connections on your exam.
summary of key concepts:
Pressure ischemia – what equation can you use to explain this phenomenon? Why would this make sense?
P1 – P2 = ΔP = Flow x Resistance
By putting external pressure on capillary beds → resistance ↑ → P1 ↑, P2 ↓, and flow ↓ → tissue hypoperfusion → ischemia → if prolonged, then necrosis
When you sit for a long time and you skin feels numb/tingling, what equation and concept can you use to explain this?
Equation: P1 – P2 = ΔP = Flow x Resistance
Concept: transient ischemia = dysfunction
Sitting for a long time → resistance ↑ → flow ↓ → transient nerve ischemia → transient dysfunction (e.g., numbness, paresthesias)
Pressure ulcers – what equation and concept can you use to explain this?
Equation: P1 – P2 = ΔP = Flow x Resistance
Concept: prolonged ischemia = necrosis
Long pressure on tissue → resistance ↑ → flow ↓ → prolonged tissue (muscle, skin) ischemia → necrosis → skin breakdown → ulceration
Heart murmurs – physiologically, what are the ways that a murmur volume can increase? Use an equation to explain
In a general sense, a heart murmur can occur when there is:
-
- 1) A more diseased valve/portion of blood vessel, and/or
- 2) Greater velocity of blood across that valve / vessel
For 2), you can use the equation ΔP = Flow x Resistance, with flow as a rough approximation of blood velocity for a fixed valve lesion
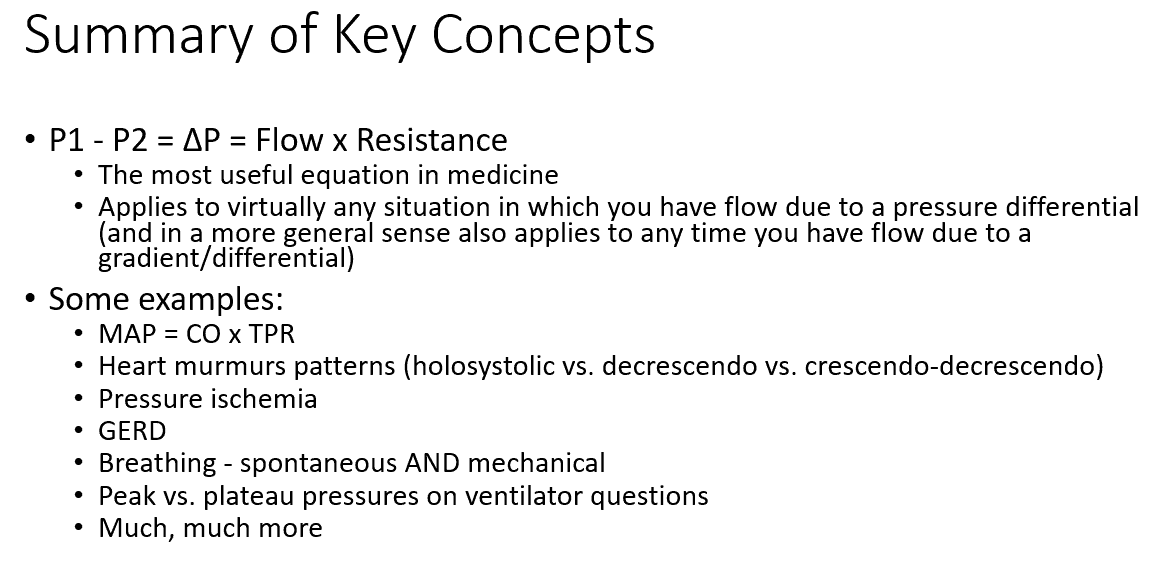
Using the equation P1 – P2 = Flow x Resistance, explain at what point the aortic valve opens?
P1 = LV pressure, P2 = aortic pressure
When (P1 – P2) is a positive number, flow is positive. Thus, it makes sense that the aortic valve would open when LV pressure > aortic pressure
Using the equation P1 – P2 = Flow x Resistance, explain at what point the mitral valve opens?
P1 = LA pressure, P2 = LV pressure
When (P1 – P2) is a positive number, flow is positive. Thus, it makes sense that the mitral valve would open when LA pressure > LV pressure
Aortic flow – RELATIVELY speaking, just after the aortic valve opens, what will be the flow across the aortic valve? Use an equation to make sense of this.
Recall: P1 – P2 = Flow x Resistance
For flow across the aortic valve:
P1 = LV pressure (blood coming FROM)
P2 = aortic pressure (blood going TO)
Resistance = aortic valve resistance
At the moment the aortic valve opens, P1 will be BARELY higher than P2. As such, flow will be positive (but barely)
Aortic flow – RELATIVELY speaking, at mid-systole, what will the flow be relative to the beginning of systole? Why?
Recall: P1 – P2 = Flow x Resistance
For flow across the aortic valve:
P1 = LV pressure (blood coming FROM)
P2 = aortic pressure (blood going TO)
Resistance = aortic valve resistance
At the moment the aortic valve opens, P1 will be BARELY higher than P2. As such, flow will be positive (but barely)
Near mid-systole, however, (P1 – P2) ↑ → flow ↑
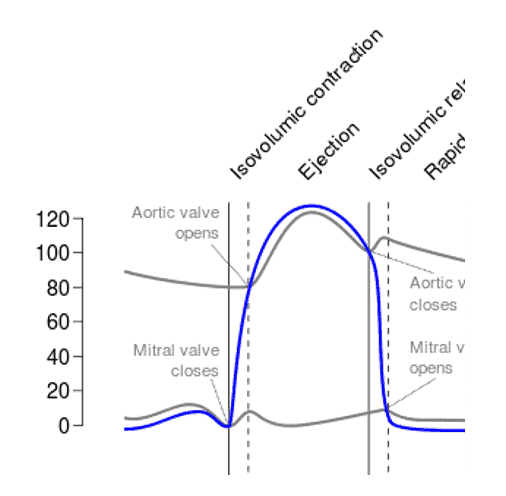
Aortic stenosis – using an equation, explain what the character of the murmur will be (e.g., holosystolic, decrescendo, crescendo-decrescendo). Why does this make sense?
Crescendo-decrescendo
Recall: P1 – P2 = Flow x Resistance
For flow across the aortic valve:
P1 = LV pressure (blood coming FROM)
P2 = aortic pressure (blood going TO)
Resistance = aortic valve resistance
As the LV contracts → P1 ↑. Initially, (P1 – P2) ↑ → flow ↑ → murmur will crescendo (get louder) earlier.
However, as near the end of systole, (P1 – P2) ↓ → flow ↓ → murmur will decrescendo (get softer)
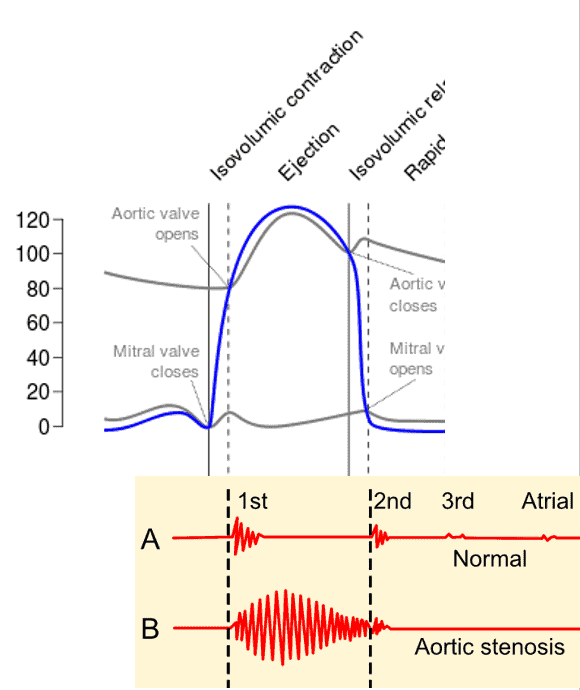
Aortic regurgitation – using an equation, explain when will the regurgitant flow be the greatest across the aortic valve?
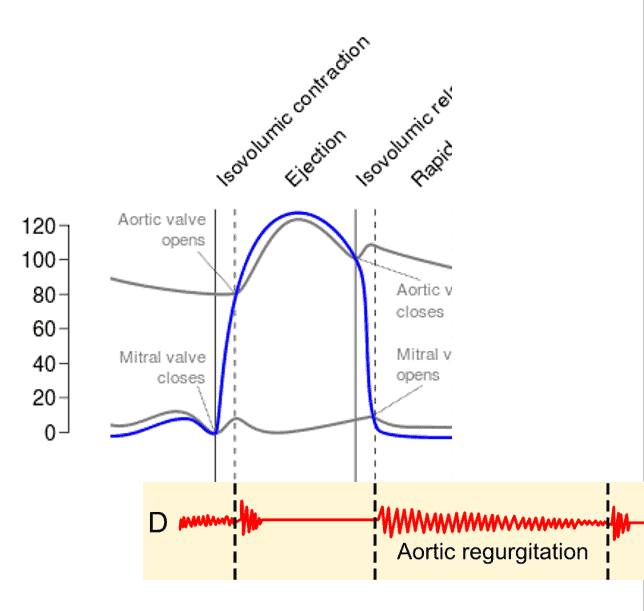
Regurgitant flow will be highest after the mitral valve opens
Recall: P1 – P2 = Flow x Resistance
In this case, because it is blood REGURGITATION (the reverse of normal):
P1 = aortic pressure (blood coming FROM)
P2 = LV pressure (blood going TO)
Just after the mitral valve opens:
-
- P1 is relatively high (before much blood has been distributed to the rest of the body)
- P2 is at the lowest (it has just ejected its stroke volume, and hasn’t been filled up by the LA / aorta yet)
In other words, the moments after the mitral valve opens (P1 – P2) highest → flow highest
Aortic regurgitation – using an equation, explain what the character of the murmur will be (e.g., holosystolic, decrescendo, crescendo-decrescendo). Why does this make sense?
Decrescendo
Recall: P1 – P2 = Flow x Resistance
In this case, because it is blood REGURGITATION (the reverse of normal):
P1 = aortic pressure (blood coming FROM)
P2 = LV pressure (blood going TO)
Just after the mitral valve opens:
-
- P1 is relatively high (before much blood has been distributed to the rest of the body)
- P2 is at the lowest (it has just ejected its stroke volume, and hasn’t been filled up by the LA / aorta yet)
In other words, the moments after the mitral valve opens (P1 – P2) highest → flow highest → murmur loudest early → as (P1-P2) ↓ → regurgitant flow ↓ → murmur softer later in the cycle
references:
GERD.png. (2020, October 7). Wikimedia Commons, the free media repository. Retrieved 02:02, April 27, 2021 from https://commons.wikimedia.org/w/index.php?title=File:GERD.png&oldid=483203113.
Pulmonary artery catheter english.JPG. (2020, October 18). Wikimedia Commons, the free media repository. Retrieved 02:20, April 2, 2021 from https://commons.wikimedia.org/w/index.php?title=File:Pulmonary_artery_catheter_english.JPG&oldid=493462725.
Circulation of blood through the heart.png. (2020, December 23). Wikimedia Commons, the free media repository. Retrieved 04:13, April 2, 2021 from https://commons.wikimedia.org/w/index.php?title=File:Circulation_of_blood_through_the_heart.png&oldid=520574500.
Radial artery catheterization.jpg. (2020, October 7). Wikimedia Commons, the free media repository. Retrieved 05:01, April 2, 2021 from https://commons.wikimedia.org/w/index.php?title=File:Radial_artery_catheterization.jpg&oldid=483583496.
Phonocardiograms from normal and abnormal heart sounds.png. (2020, October 3). Wikimedia Commons, the free media repository. Retrieved 06:06, April 2, 2021 from https://commons.wikimedia.org/w/index.php?title=File:Phonocardiograms_from_normal_and_abnormal_heart_sounds.png&oldid=478934031.
Wiggers Diagram.svg. (2020, September 12). Wikimedia Commons, the free media repository. Retrieved 06:07, April 2, 2021 from https://commons.wikimedia.org/w/index.php?title=File:Wiggers_Diagram.svg&oldid=456197904.